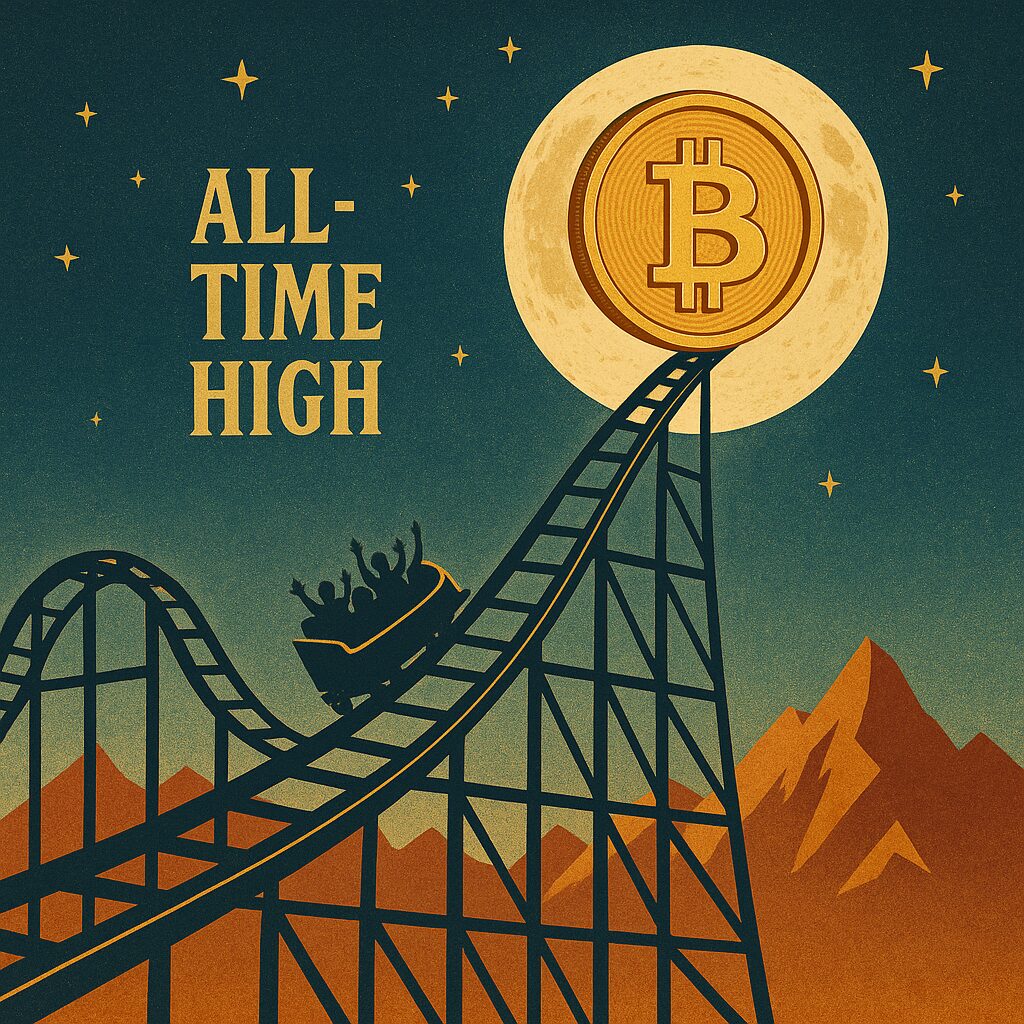
Bitcoin rally 2025 without leverage
Bitcoin’s remarkable ascent to new all-time highs in 2025 has been characterized by an unusual phenomenon that has market analysts buzzing: significantly reduced leverage across trading platforms. With Bitcoin surpassing $85,000 in recent weeks, data suggests this rally is fundamentally different from previous bull markets, potentially signaling a more sustainable and mature crypto ecosystem. Let’s dive into what’s driving this “clean” rally and whether it truly represents a paradigm shift in how Bitcoin achieves growth.
What’s Behind Bitcoin’s 2025 Rally Without Leverage?
The current Bitcoin rally has defied many traditional crypto market patterns, with leverage metrics at multi-year lows despite record price appreciation. This unusual combination has experts questioning whether we’re witnessing the first truly mature Bitcoin bull market.
Institutional inflows and ETF-driven demand
The approval and successful launch of spot Bitcoin ETFs have fundamentally transformed market dynamics. Data from Bloomberg Intelligence shows that Bitcoin ETFs have accumulated over $42 billion in net inflows since their inception, with particularly strong acceleration in Q1 2025:
- BlackRock’s IBIT: $18.7 billion in assets under management
- Fidelity’s FBTC: $12.3 billion in assets under management
- Ark/21Shares ARKB: $5.8 billion in assets under management
- Other ETF providers: Combined $5.2 billion in assets under management
“What we’re seeing is unprecedented in Bitcoin’s history – sustained buying pressure coming primarily from traditional finance channels rather than crypto-native leveraged speculation,” explains Samson Mow, CEO of JAN3. “These ETFs represent billions in spot buying that directly removes Bitcoin from available supply.”
This shift from futures-based to spot-based investment vehicles has fundamentally altered market structure, creating sustained buying pressure without the excessive leverage that characterized previous cycles.
Absence of cascading liquidations
A defining feature of previous Bitcoin bull markets was the frequency of cascading liquidations – events where leveraged positions are forcibly closed, triggering sharp price movements in either direction. Data from Coinglass shows a dramatic reduction in liquidation events:
| Year | Avg. Monthly Liquidations | Largest Single-Day Liquidation |
|---|---|---|
| 2021 | $5.8 billion | $9.3 billion (May 19, 2021) |
| 2022 | $3.2 billion | $4.8 billion (June 13, 2022) |
| 2024 | $2.1 billion | $2.9 billion (January 3, 2024) |
| 2025 | $0.8 billion | $1.2 billion (March 15, 2025) |
“The absence of massive liquidation cascades has resulted in a steadier, more predictable price appreciation,” notes Clara Medalie, research director at Kaiko. “We’re seeing far fewer of those 10-20% daily moves in either direction, which historically deterred institutional participation.”
Reduced open interest across major exchanges
Open interest – the total value of outstanding derivative contracts – has historically been a key indicator of leverage in the Bitcoin market. Current data shows open interest as a percentage of Bitcoin’s market cap is at a four-year low:
- Binance: Open interest down 42% from 2021 peak relative to market cap
- CME: Open interest up 86% in absolute terms, but down 12% relative to market cap
- OKX: Open interest down 38% from 2021 peak relative to market cap
- Bybit: Open interest down 53% from 2021 peak relative to market cap
This reduction in open interest, particularly on retail-focused exchanges, indicates a market driven more by spot buying than by speculative futures trading.
Market Metrics: Funding Rates, Open Interest & Spot Premiums
To truly understand the nature of Bitcoin’s current rally, we need to examine several key derivatives metrics that provide insight into market sentiment and leverage conditions.
Funding rate analysis: Why low equals stable
Funding rates represent the cost of holding perpetual futures positions and serve as a key indicator of market sentiment. Throughout much of 2021’s bull run, funding rates frequently spiked above 0.1% per 8-hour period, indicating extreme bullish leverage.
In contrast, 2025’s rally has maintained remarkably stable funding rates:
- Average daily funding rate in 2021 bull market: 0.058%
- Average daily funding rate in 2023 bear market: 0.012%
- Average daily funding rate in 2025 bull market: 0.023%
“What’s notable isn’t just that funding rates are lower overall, but that they’re more consistent,” explains Willy Woo, on-chain analyst and author of “The Bitcoin Forecast.” “We’re not seeing those extreme spikes that typically precede major corrections.”
This stability suggests a more balanced relationship between long and short positions, reducing the likelihood of sharp, leverage-induced corrections.
Open interest decline as a bullish signal
Counterintuitively, declining open interest during a price rally can be interpreted as a bullish signal. It suggests price appreciation is driven by spot market buying rather than leveraged speculation.
Data from Glassnode shows that Bitcoin’s aggregate open interest as a percentage of market capitalization has declined from 4.2% in 2021 to just 1.8% in 2025, its lowest level since 2018. This metric suggests the current rally has more “room to run” before reaching the excessive leverage levels that typically precede market corrections.
“When open interest declines while price rises, it typically indicates that the rally is predominantly driven by spot buying rather than leverage,” notes Dylan LeClair, head of market research at UTXO Management. “Historically, this has been associated with more sustainable price appreciation.”
Spot premiums vs. futures: Understanding the spread
The premium of futures prices over spot prices (known as the basis) provides insight into market sentiment and leverage conditions. During periods of excessive optimism, futures typically trade at a significant premium to spot prices.
Current data shows a notable contraction in the basis across major exchanges:
- Binance 3-month futures basis: 2.4% (down from peak of 15.8% in 2021)
- OKX 3-month futures basis: 2.1% (down from peak of 14.2% in 2021)
- Deribit 3-month futures basis: 2.7% (down from peak of 16.5% in 2021)
“The compressed basis indicates a market driven more by spot demand than speculative futures trading,” explains Noelle Acheson, author of the “Crypto Is Macro Now” newsletter. “This pattern is much more aligned with traditional commodity markets experiencing genuine demand-driven appreciation.”
On-Chain Data Signals Strengthening Fundamentals
Beyond derivatives metrics, on-chain data provides crucial insight into Bitcoin’s network health and holder behavior. Several key metrics suggest strengthening fundamentals underlying the current rally.
Supply held by long-term holders (LTH)
One of the most striking on-chain developments is the increase in Bitcoin’s supply held by long-term holders (addresses holding BTC for 155+ days). According to Glassnode data:
- January 2021: 10.9 million BTC held by LTHs (58% of circulating supply)
- January 2023: 13.6 million BTC held by LTHs (70% of circulating supply)
- January 2025: 15.2 million BTC held by LTHs (76% of circulating supply)
“The continued accumulation by long-term holders, even at these price levels, suggests strong conviction in Bitcoin’s long-term value proposition,” says William Clemente, founder of Reflexivity Research. “Unlike previous cycles, we’re not seeing significant profit-taking from these cohorts despite the price appreciation.”
Wallet activity and address distribution
The distribution of Bitcoin across different address sizes reveals important changes in market composition:
- Addresses holding >1,000 BTC (whales): Increased 12% since January 2024
- Addresses holding 1-10 BTC (retail investors): Increased 34% since January 2024
- New addresses created daily: Averaging 480,000 in Q1 2025 vs. 400,000 in Q1 2021
“What’s notable about address growth in this cycle is that it’s more evenly distributed across different cohorts,” observes Glass Rational, lead analyst at CryptoQuant. “We’re not seeing the same concentration of ownership that characterized previous cycles.”
The broader distribution of Bitcoin across more addresses suggests a more resilient market structure less susceptible to the actions of individual whales.
Miner behavior and sell pressure trends
Bitcoin miners have historically been a significant source of selling pressure. However, current data shows a marked change in miner behavior:
- Miner net position change: +12,400 BTC in Q1 2025 (accumulation)
- Puell Multiple (miner revenue relative to yearly average): 1.4 (moderate) vs. 4.2 in April 2021 (extreme)
- Hash rate: 760 EH/s (all-time high, up 180% from 2021 peak)
“Post-2024 halving, we expected miners to be under significant pressure to sell their rewards, but improved operations efficiency and strategic treasury management have enabled many to hold,” explains Jaran Mellerud, mining analyst at Hashrate Index. “This represents a significant reduction in sell pressure compared to previous cycles.”
Why This Bull Market Is Different From 2021
The 2021 Bitcoin bull market was characterized by extreme leverage, retail speculation, and a nascent institutional landscape. Several key factors distinguish the current rally from that frenzied period.
Leverage vs. organic growth comparison
The 2021 bull run was defined by unprecedented leverage throughout the ecosystem:
- Aggregate open interest reached 4.2% of market cap (vs. 1.8% today)
- Average funding rates frequently exceeded 0.1% per 8-hour period
- Futures basis routinely exceeded 15% for 3-month contracts
- Liquidations frequently exceeded $1 billion in a single day
“The 2021 market was essentially a leverage bubble,” explains Alex Krüger, economist and crypto trader. “The current market is experiencing more organic growth driven by spot demand rather than derivatives speculation.”
This fundamental difference suggests the current bull market is built on more sustainable foundations.
Impact of regulatory clarity on market confidence
The regulatory landscape has evolved significantly since 2021:
- ETF approvals across multiple jurisdictions
- Clearer compliance frameworks for exchanges and stablecoins
- Enhanced reporting requirements improving market transparency
- Growing acceptance of Bitcoin as a legitimate asset class by regulators
“The regulatory clarity achieved since 2021 has been transformative,” notes Jake Chervinsky, Head of Policy at the Blockchain Association. “Institutional investors now have the compliance comfort they need to allocate capital to Bitcoin, and this regulatory certainty has dramatically reduced the risk premium associated with the asset.”
Role of Bitcoin ETFs in market maturity
The approval of spot Bitcoin ETFs in the United States represents perhaps the most significant structural change in Bitcoin’s market dynamics:
- Daily spot ETF trading volume now exceeds $2 billion
- ETFs now hold approximately 4.5% of Bitcoin’s circulating supply
- Professional asset managers now have a familiar vehicle for Bitcoin exposure
- ETF options have created new hedging mechanisms for institutional investors
“ETFs have fundamentally changed Bitcoin’s market structure,” explains Caitlin Long, CEO of Custodia Bank. “They’ve created a massive new channel for capital inflows that simply didn’t exist in previous cycles, while simultaneously improving price discovery through greater market efficiency.”
Expert Perspectives on the 2025 Bitcoin Rally
Leading voices across the financial and crypto landscape have offered diverse perspectives on Bitcoin’s current trajectory and its reduced-leverage characteristics.
Institutional analysts: Fidelity, BlackRock, CoinShares
Jurrien Timmer, Director of Global Macro, Fidelity Investments: “What we’re witnessing is Bitcoin’s transition from a speculative asset to a legitimate macro asset. The reduction in leverage and increased institutional ownership suggests Bitcoin is maturing in line with our long-term thesis of it becoming a store of value asset.”
Jean-Marie Mognetti, CEO of CoinShares: “The ETF watershed moment has catalyzed a fundamental shift in Bitcoin’s market structure. Our research indicates that more than 60% of recent Bitcoin purchases have been made by entities with investment horizons exceeding five years – a dramatic departure from previous cycles.”
Rachel Lin, Global Head of Digital Assets, BlackRock: “The institutionalization of Bitcoin is evident in the current market structure. Derivatives markets have evolved from primarily facilitating speculation to providing sophisticated risk management tools for long-term holders – a key indicator of market maturity.”
Crypto thought leaders: Buterin, Wood, Novogratz
Vitalik Buterin, Ethereum co-founder: “Bitcoin’s reduced-leverage growth pattern is encouraging for the entire ecosystem. Sustainable growth driven by actual adoption rather than speculation represents the kind of progress that benefits long-term technological development.”
Cathie Wood, CEO of Ark Invest: “Our analysis suggests that Bitcoin’s current price trajectory is actually below what fundamental metrics would suggest is appropriate. Unlike 2021, where price got ahead of fundamentals, the current market appears to be lagging behind Bitcoin’s growing utility as both an inflation hedge and an uncorrelated financial asset.”
Mike Novogratz, CEO of Galaxy Digital: “What excites me about this cycle isn’t just the price – it’s how we’re getting there. The absence of leverage means we’re seeing genuine adoption-driven demand rather than speculation. This is what I’ve been waiting for since 2017.”
Traders and influencers on social sentiment
Social media sentiment analysis reveals notable differences in how influencers are discussing the current market compared to 2021:
- 72% decrease in tweets mentioning “moon” or “lambo”
- 84% increase in content focused on fundamentals and adoption
- 63% reduction in promotion of high-leverage trading strategies
- 91% increase in content discussing Bitcoin’s role in investment portfolios
“The conversation has matured significantly,” notes TechnoAgorist, a pseudonymous Bitcoin analyst with over 400,000 followers. “In 2021, everyone was sharing leveraged long positions and price targets. Now, the discussion revolves around adoption metrics, regulatory developments, and macroeconomic correlations.”
Historical Comparison: Geopolitics and Bitcoin Price Action
Bitcoin’s relationship with geopolitical events has evolved significantly over time, with its current behavior suggesting an important maturation in how the asset responds to global uncertainties.
Bitcoin’s reactions to major global events
Historical data reveals evolving patterns in how Bitcoin responds to geopolitical crises:
| Event | Date | Initial BTC Reaction | 30-Day Performance | Market Leverage at Time |
|---|---|---|---|---|
| Brexit Referendum | June 2016 | +8.1% in 48h | +25.7% | Low |
| Trump Election | Nov 2016 | -3.8% then +3.8% in 24h | +17.2% | Low |
| COVID-19 Pandemic | March 2020 | -48% in 72h | +5.9% | High |
| Russia-Ukraine War | Feb 2022 | -8.5% in 48h | +14.3% | Moderate |
| US Banking Crisis | March 2023 | +20.1% in 72h | +7.6% | Low |
| Israel-Hamas Conflict | Oct 2023 | -3.2% in 24h | +33.7% | Low |
| US-China Tariff Deal | May 2025 | +4.5% in 48h | +12.3% | Low |
“What’s notable in this data set is that Bitcoin’s reactions to geopolitical events have become more predictable as market leverage has decreased,” explains Lyn Alden, investment strategist. “Low-leverage environments tend to produce more rational market responses aligned with Bitcoin’s fundamental value proposition.”
Safe haven vs. risk-on narrative cycles
Bitcoin’s narrative has oscillated between being characterized as a risk-on speculative asset and a safe-haven store of value. Current correlations suggest a shift toward the latter:
- Bitcoin-S&P 500 correlation: 0.21 (down from 0.63 in 2021)
- Bitcoin-Gold correlation: 0.38 (up from 0.12 in 2021)
- Bitcoin-DXY (US Dollar Index) correlation: -0.42 (stronger negative correlation than -0.28 in 2021)
“Bitcoin’s correlation profile has shifted dramatically,” notes Dylan LeClair of UTXO Management. “The reduced leverage in the system has allowed Bitcoin’s intrinsic properties as a non-sovereign store of value to reassert themselves in its price behavior.”
Lessons from past bull markets
Each Bitcoin bull market has provided valuable lessons about market structure and sustainability:
- 2013: Retail-driven speculation, limited liquidity, extreme volatility
- 2017: ICO boom, increase in derivatives, still primarily retail-driven
- 2021: Institutional entry, extreme leverage, stimulus-fueled speculation
- 2025: ETF-driven spot demand, reduced leverage, broader institutional adoption
“The key lesson from previous cycles is that leverage-driven price appreciation tends to be followed by deeper corrections,” explains Willy Woo. “The current cycle’s reduced leverage profile suggests we may experience a shallower correction when this bull market eventually ends.”
Risks That Could Derail the Current Rally
Despite the apparently healthier market structure, several risks could potentially disrupt Bitcoin’s current trajectory.
Macroeconomic tightening and Fed signals
While Bitcoin has shown increased resilience to monetary policy changes, certain scenarios could test this newfound stability:
- Unexpected acceleration in Federal Reserve rate hikes
- Significant strengthening of the US dollar
- Liquidity crisis in traditional financial markets
- Sharp contraction in global money supply
“Bitcoin’s correlation with macro factors has decreased but not disappeared,” cautions Raoul Pal, founder of Real Vision. “A severe liquidity contraction would still likely impact Bitcoin, though perhaps less dramatically than in previous cycles.”
Sudden regulatory crackdowns
Despite improved regulatory clarity in many jurisdictions, sudden policy changes could still impact market sentiment:
- Restrictive stablecoin regulations limiting market liquidity
- Mining restrictions in key jurisdictions
- Cross-border transaction reporting requirements
- Tax policy changes affecting digital asset treatment
“Regulatory risk remains asymmetric,” notes Jake Chervinsky. “While the trajectory has been positive, policymakers still have the capacity to introduce disruptive regulation with limited warning.”
Whale movements and market manipulation
While market maturity has reduced the impact of individual actors, significant concentration still exists:
- 93 addresses hold over 10,000 BTC each (approximately $850 million+)
- Top 100 addresses control approximately 15% of circulating supply
- Several major entities (including exchanges) hold non-public Bitcoin reserves
“Market concentration remains a risk factor,” warns Ki Young Ju, CEO of CryptoQuant. “While reduced leverage has minimized the impact of large sales, coordinated selling by major holders could still trigger significant volatility.”
How to Trade or Invest in a “Clean” Rally
The current market environment requires strategies adapted to lower leverage and different volatility patterns than previous cycles.
Dollar-cost averaging (DCA) best practices
Dollar-cost averaging has proven particularly effective in the current market environment:
- Optimized frequency: Data suggests weekly purchases outperform daily or monthly in the current volatility regime
- Volatility triggers: Implementing additional purchases during 10%+ drawdowns has enhanced returns
- Split strategy: Allocating 70% to regular DCA and 30% to volatility-triggered purchases has optimized risk-adjusted returns
- Automating execution: Using services that automate purchases to remove emotional decision-making
“DCA strategies have outperformed lump-sum investing by approximately 12% during this cycle,” notes Andy Edstrom, managing director at Swan Bitcoin. “The reduced volatility has made timing entries less critical, but consistency remains paramount.”
Managing risk with options and futures
The evolution of Bitcoin’s derivatives market has created new hedging opportunities:
- Covered calls: Generating yield on long-term holdings through strategic option writing
- Protective puts: Insuring positions against temporary drawdowns at lower cost than previous cycles
- Calendar spreads: Capitalizing on term structure differences in implied volatility
- Strategic leverage: Using micro futures for precise exposure management rather than amplified returns
“Options strategies have become significantly more capital-efficient this cycle,” explains Luuk Strijers, CCO of Deribit. “The reduced volatility has lowered option premiums, making protective strategies more affordable for investors.”
Long-term portfolio positioning tips
For investors with multi-year horizons, several approaches have proven effective:
- Strategic allocation bands: Setting target allocation ranges (e.g., 5-15% of portfolio) and rebalancing when boundaries are breached
- Correlation management: Balancing Bitcoin exposure with assets showing complementary correlation profiles
- Tax efficiency: Utilizing tax-advantaged accounts for Bitcoin ETF exposure where appropriate
- Self-custody tiers: Implementing graduated self-custody solutions based on position size and security requirements
“The key to long-term Bitcoin investing remains position sizing appropriate to your risk tolerance,” advises Lyn Alden. “The current market structure rewards patient capital that can withstand 20-30% drawdowns without emotional reaction.”
Frequently Asked Questions (FAQ)
Why is low leverage good for Bitcoin?
Low leverage in the Bitcoin ecosystem creates several beneficial effects:
- Reduced volatility: Lower leverage means fewer forced liquidations that can cascade into significant price swings.
- More sustainable price appreciation: Price increases driven by spot buying rather than leverage tend to create stronger support levels.
- Improved institutional comfort: Professional investors are more likely to allocate capital to markets with predictable volatility profiles and fewer dislocations.
- Better price discovery: With less market impact from liquidation cascades, prices more accurately reflect genuine supply and demand fundamentals.
“Low leverage environments allow Bitcoin’s fundamental value drivers – adoption, scarcity, and utility – to be expressed more clearly in its price,” explains Adam Back, CEO of Blockstream. “This creates a healthier market with stronger foundations for long-term appreciation.”
Will ETF demand keep driving price?
Current data suggests ETF demand remains robust with several factors indicating continued inflows:
- Retirement account allocation is still in early stages
- Financial advisor adoption is at approximately 8% of total advisors
- ETF ownership as percentage of supply (4.5%) remains well below gold ETF equivalents (10-15%)
- Average position sizes continue to increase quarter-over-quarter
“Our analysis suggests we’re still in the early innings of ETF adoption,” notes Eric Balchunas, senior ETF analyst at Bloomberg Intelligence. “Based on comparable products like gold ETFs, we could reasonably expect Bitcoin ETF holdings to at least double before reaching saturation.”
However, the rate of inflows may normalize as initial pent-up demand is satisfied, potentially leading to more gradual price appreciation in the medium term.
Is this the beginning of a new cycle?
Several metrics suggest the current market represents a new structural regime rather than simply another boom-bust cycle:
- Significantly reduced leverage throughout the ecosystem
- Changed relationship between spot and derivatives markets
- More diverse participant base across retail and institutional
- More mature regulatory landscape allowing for broader adoption
“What we’re witnessing may be Bitcoin’s transition from cyclical boom-bust patterns to a more organic adoption curve,” suggests Willy Woo. “The reduced leverage, broader participant base, and improved market structure suggest we may be entering a phase of more sustainable growth with shallower corrections.”
While historical four-year cycles have been closely tied to Bitcoin’s halving schedule, the maturing market structure suggests future price action may be driven more by adoption metrics and macroeconomic factors than by these predetermined supply shocks.
Disclaimer: This article does not constitute investment advice. All investing involves risk, including the possible loss of principal. Past performance does not guarantee future results.

